
Brooklyn's Untapped Biking Potential
Why The Borough Could Become The Amsterdam Of America, Outlined In Four Visualizations

Background
Living in Brooklyn, finding the fastest way around isn't always straightforward. While the subway avoids street traffic, its routes might not be direct and there can be wait times. Cars aren’t much better, as New York ranks as the most congested city in America. I began to notice on Google Maps that biking often appeared quicker than driving or taking public transit for trips well beyond the neighborhood I was in. This got me curious about the viability of biking as a primary form of transportation: How much cheaper is biking compared to driving? Is it faster? What other transportation benefits does biking offer? And why aren't more people doing it? I've distilled my findings into four easy-to-understand visualizations.
Visualization 1: Using A Car In Brooklyn Is Expensive

Most Americans see car ownership as essential, so we seldom ponder the costs without them. This visualization shows that whether you opt for a used car, rely solely on Uber, or even pay for parking convenience, a week of car usage can exceed the yearly expenses of biking.
Source(s):
Car Ownership Cost-Nerd Wallet; I used the averages in the car cost calculator
Parking Cost-SpotHero; The average Brooklyn parking garage cost is in the FAQ
Uber Cost-NetCredit; Average cost for a 6.2 mile Uber ride for NYC
CitiBike Cost-CitiBike; CitiBikes website, where they list the price
Visualization 2: Biking In Brooklyn Is Fast

This is the heart of my analysis: Most bike trips in Brooklyn, particularly those under 5 miles, match or nearly match the speed of driving. Considering traffic unpredictability and parking time, biking often emerges as the better choice. Even with Brooklyn's current bike infrastructure, which doesn't do much for safety or trip quality, biking is a genuine city transport alternative for most journeys. Click here to see details for the specific trips of this visualization.
Source(s):
Google Maps Directions API (link to the data on GitHub)
I pulled data for typical weekday traffic conditions. For the trips, I simply selected the center of each of Brooklyn’s 36 physical zip codes and analyzed drive and bike time to each of the other 35 zip codes, amounting to 1260 total trip in the dataset.
Visualization 3: Biking Multiplies Subway Access
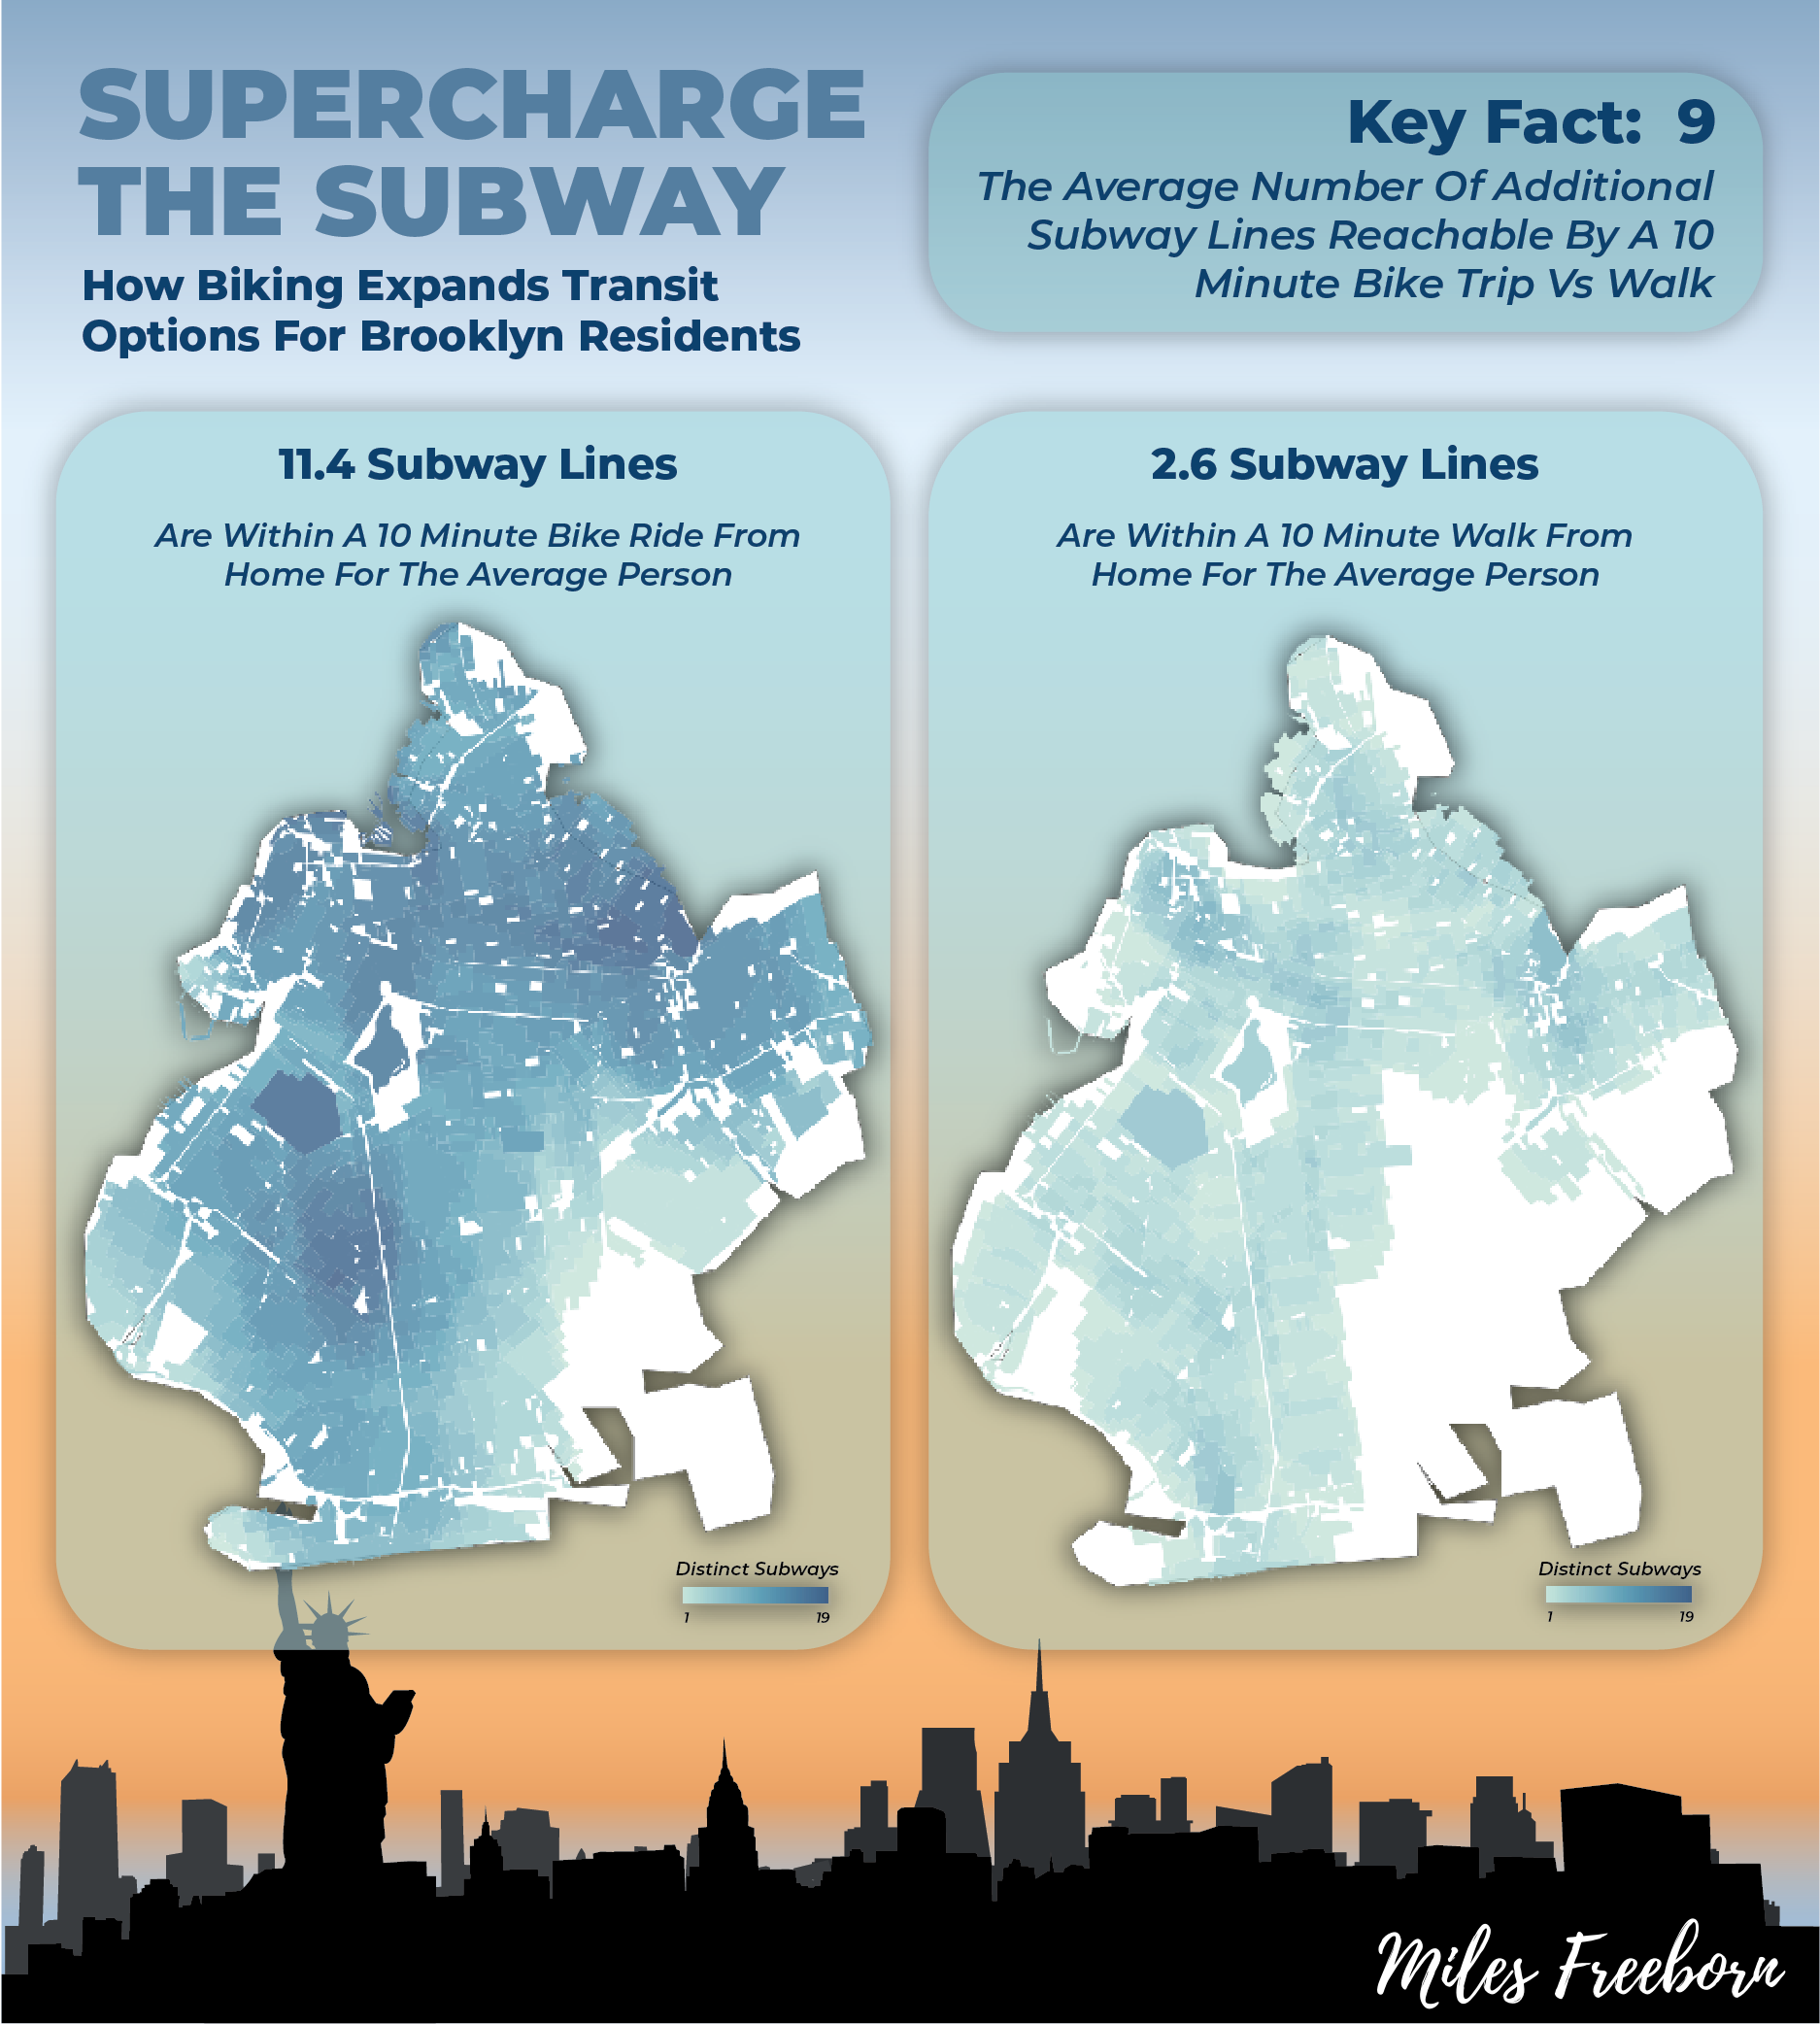
Biking offers more than just a way to move from one spot to another; it greatly broadens subway access in Brooklyn. A common grievance among residents is the limited transit options within the borough itself. To reach another part of Brooklyn, many often need to travel via Manhattan. While some lines do run North-South, they aren't convenient for most residents. Inspired by this OhTheUrbanity YouTube video, I compared how many subway lines are within a half-mile walk to those within a 1.5-mile bike ride, roughly a 10-minute journey. The data was clear: biking vastly expands transit options, making many more routes accessible to numerous residents.
Source(s):
NYC Open Data-Subway Stations; Plots the points of all subway stations and lines
NYC.Gov-Census Blocks Map; The spatial file for Brooklyn’s Census Blocks
NYC.Gov-Census Block Populations; The population of each Census Block
GitHub Repository; The data after making small format changes
Visualization 4: Biking in Brooklyn Is Currently Not Safe
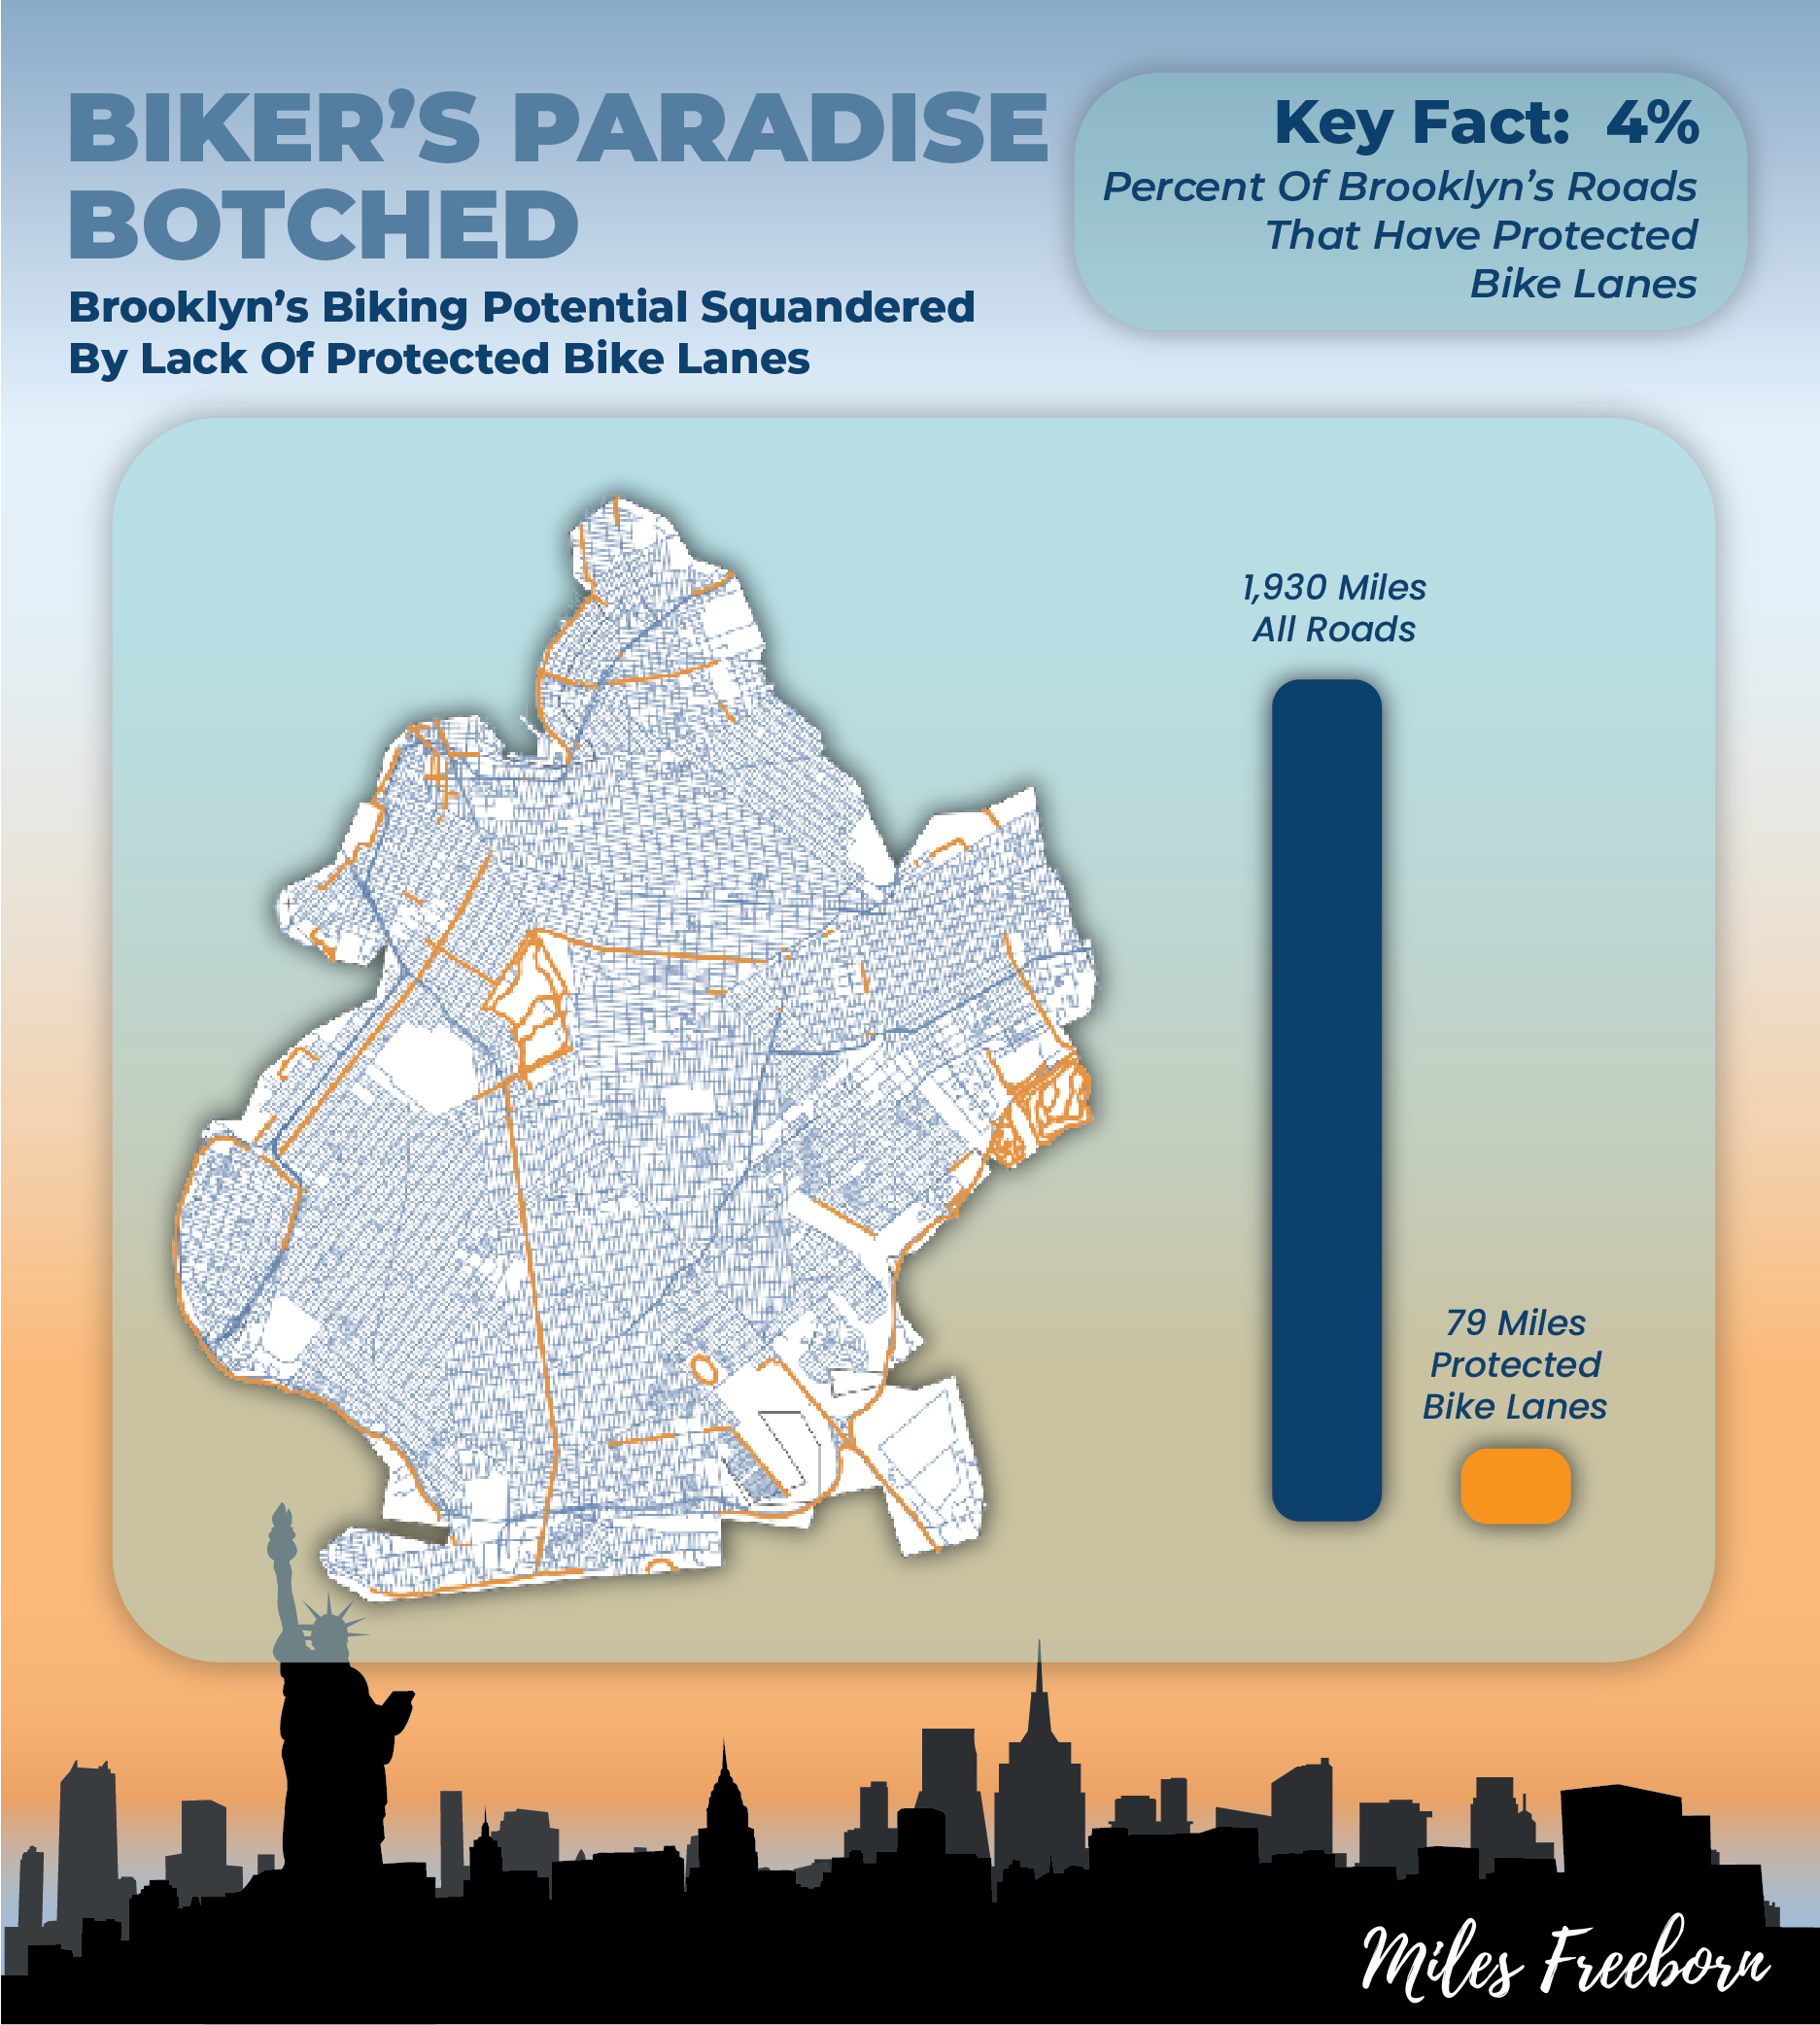
Biking is economical and quick, and it even enhances subway accessibility. However, biking in Brooklyn isn't safe. Merely 4% of Brooklyn's roads have bike lanes, and this percentage is misleadingly boosted by clusters of paths within its major parks. A 2019 NYU study emphasized that the primary concern deterring potential cyclists is the lack of safety. Simply put, if you wouldn't feel safe letting your kids bike on the streets, then the bike network isn't truly safe.
Source(s)
NYC Open Data-Roads; Shows all road routes and road types including bike lanes
GitHub Repository; Python Script to quantify road length
Call To Action: Build Way More Protected Bike Lanes
Brooklyn grapples with the twin challenges of congestion and bureaucratic complexity. However, revamping its bike infrastructure wouldn't be pioneering work. Paris is currently overhauling its urban layout, with cities like Oslo following suit. What's more, bike-friendly infrastructure is notably more affordable than our prevailing car-focused designs. It's essential to recognize that public spaces aren't just for cars. A road with 100 parking spots might serve better by accommodating 10,000 bikes. If you find this topic resonant, I urge you to engage with local organizations advocating for improved bike infrastructure.